You know your fields. You’ve walked them, driven past them, watched them grow for years. But there’s a limit to what you can see from the ground — or from the truck window at 80 km/h.
NDVI drone scouting gives you the full picture. Every acre, colour-coded by crop health, delivered the same day. It shows you where problems are hiding before they spread, and more importantly, it shows you where your crop is healthy so you don’t waste money treating it.
What Is NDVI? (Plain English Version)
NDVI stands for Normalized Difference Vegetation Index. That’s a mouthful, but the concept is simple.
Healthy plants reflect a lot of near-infrared light and absorb red light for photosynthesis. Stressed or dead plants do the opposite. A multispectral camera on the drone measures both wavelengths and produces a score for every spot in the field.
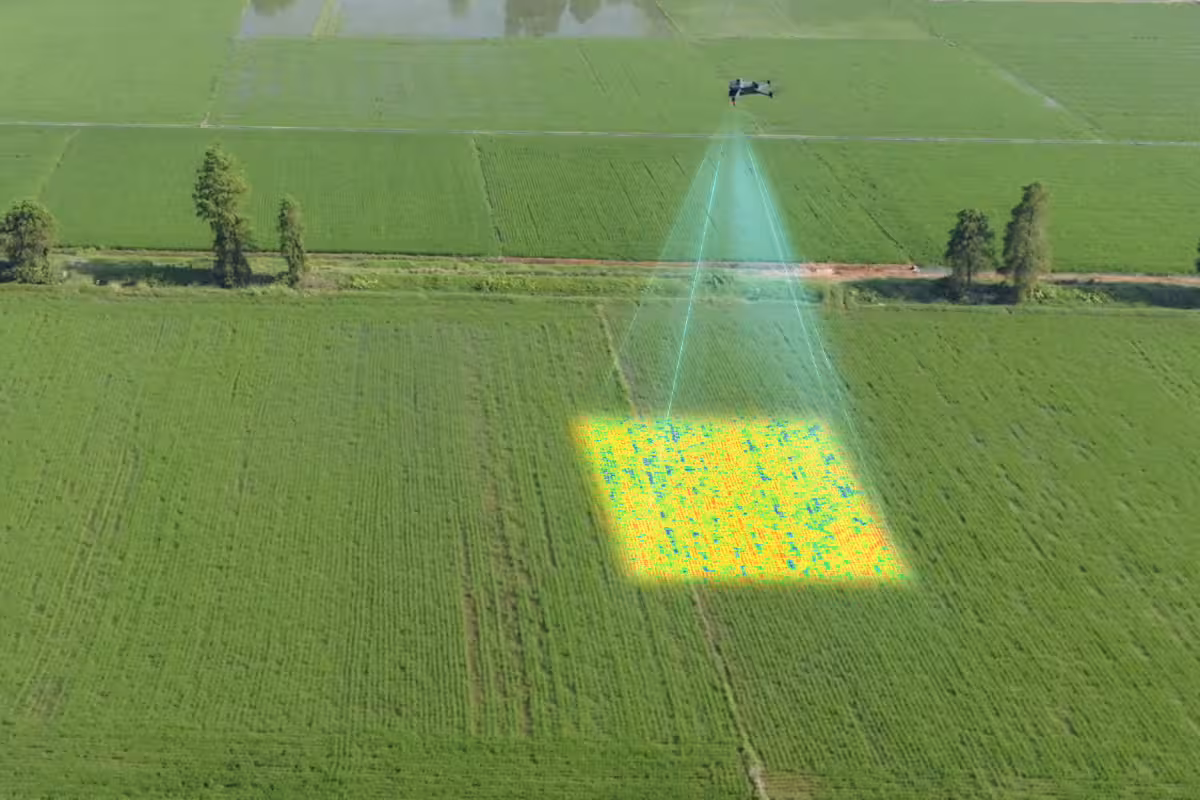
That score gets turned into a colour-coded map:
- Dark green = healthy, vigorous crop
- Light green / yellow = moderate stress — could be nutrient deficiency, moisture issues, or early disease
- Orange / red = significant stress — disease, pest damage, drown-out, or bare ground
You don’t need to understand the math. You just need to look at the map and see where the problems are.
How It Works: From Drone Flight to Decision
Here’s the process, start to finish:
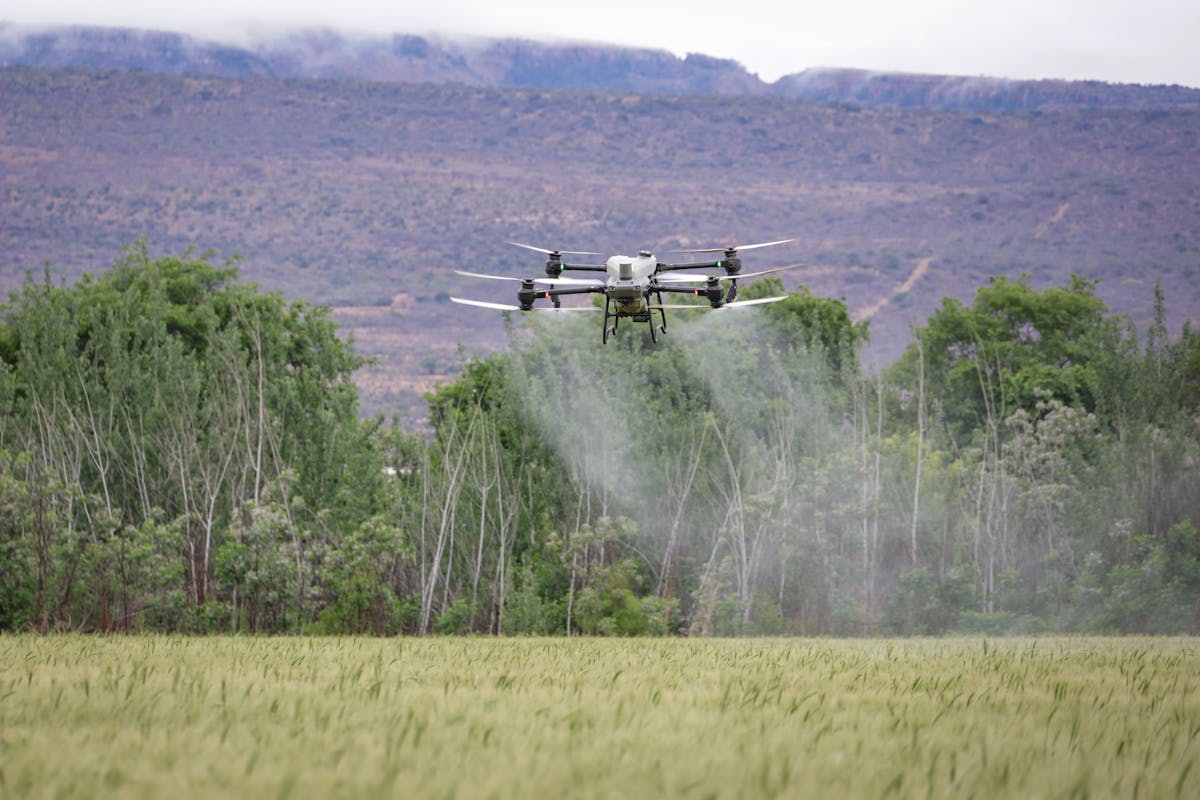
Step 1: We fly your field. Our dedicated multispectral survey drone flies a pre-programmed grid pattern over your field at about 120 metres altitude. A quarter section takes roughly 15–20 minutes.
Step 2: The data gets processed. The multispectral images are stitched together and processed into an NDVI map. You get a high-resolution colour-coded view of your entire field.
Step 3: You get your map — same day. We deliver the NDVI map along with a standard aerial photo of the field. Both are georeferenced, meaning you can zoom into any spot and know exactly where it is.
Step 4: You make targeted decisions. The map shows you where to focus. Instead of blanket spraying the whole field, you treat the areas that need it. Instead of guessing where the thin spots are, you know.
For farmers who want to go a step further, the NDVI data can be used to generate variable-rate prescriptions. That’s a map your sprayer or fertilizer spreader reads to automatically adjust rates across the field — more product where it’s needed, less where it’s not.
Real Cost Savings: The Math
Let’s run a realistic example for a 640-acre section of canola near Lacombe.
Without scouting (blanket application):
- Fungicide applied to entire 640 acres at $22/acre = $14,080
With NDVI scouting first:
- Scouting cost: 640 acres x $7/acre = $4,480
- NDVI map shows 60% of the field is healthy and low-risk for sclerotinia
- Fungicide applied to 250 acres (the areas showing stress and disease risk) = $5,500
- Total: $9,980
Savings: $4,100 — and that’s one application on one field.
Scale that across three or four fields over the season, and you’re looking at $10,000–$20,000 saved on a mid-sized operation. The scouting pays for itself many times over.
This isn’t theoretical. Precision agriculture research consistently shows that targeted application based on scouting data reduces input costs by 15–30% compared to blanket treatment.
Best Crops for NDVI Scouting
NDVI works on any green, growing crop, but some benefit more than others in central Alberta:
Canola
The big one. Canola is susceptible to sclerotinia, clubroot, and flea beetle — all of which show up as stress on NDVI maps before you can see them from the ground. Fungicide decisions on canola are expensive. Scouting first means you spray where it matters, not everywhere.
Wheat and Barley
Fusarium head blight, septoria, rust, and nutrient deficiency all create visible stress patterns on NDVI maps. Wheat and barley respond well to variable-rate nitrogen, and NDVI maps help you build the prescription.
Peas and Lentils
Pulse crops show stress from aphanomyces, ascochyta, and moisture variability clearly on multispectral imaging. These crops are also sensitive to unnecessary chemical passes, so scouting before spraying protects both your budget and your yield.
Hay and Forage
NDVI mapping shows which areas of your hayfield are thinning out, where drainage issues are hurting production, and where fertility is lacking. Useful for planning rejuvenation and targeted fertilizer application.
When to Scout: Timing Matters
Timing is everything in scouting. Fly too early and there isn’t enough canopy to measure. Fly too late and you’ve missed the treatment window.
Early season (June): Baseline flight after emergence. Identifies stand establishment problems, drown-out areas, and early weed pressure. Good for planning your first pass.
Mid-season (late June – mid-July): The most valuable window. Crop canopy is developed enough for accurate NDVI readings. This is when you catch disease onset, nutrient deficiency, and pest damage in time to act. For canola, this lines up with your fungicide decision at 20–50% bloom.
Pre-harvest (August – September): Useful for documenting crop condition before harvest, especially after hail or wind events. Creates a record for crop insurance claims. Also helps plan harvest order — cut the good stuff first, deal with problem areas after.
For most farms, two flights per season covers it. One mid-season flight for spray decisions, one pre-harvest for documentation and planning. Total cost at $6–$9/acre per flight is a fraction of what you’d spend on a single unnecessary fungicide pass.
What You Get From AgHawk
When you book a scouting flight with us, here’s what’s included:
- NDVI crop health map — colour-coded, georeferenced, high resolution
- Standard aerial photo — visible light, stitched, georeferenced
- Same-day delivery — we process in the field and send you the maps before we leave
- Quick summary — we’ll walk you through the findings and flag anything that needs attention
Maps are delivered as image files you can view on your phone, tablet, or computer. For farmers with precision ag equipment, we can also provide the data in formats compatible with John Deere Operations Center, Climate FieldView, and other platforms.
Why Not Just Walk the Field?
You absolutely should walk your fields. Boots on the ground will always matter. But consider this:
- Walking a quarter section thoroughly takes 2–4 hours. A drone covers it in 15–20 minutes.
- You see what’s at eye level. The drone sees everything from above — patterns, gradients, and problem areas that are invisible from the ground.
- Walking gives you a sample. NDVI gives you every acre, measured and mapped.
Drone scouting doesn’t replace your field walk. It makes your field walk shorter and more focused. Check the red zones first, then confirm what the map is telling you. You’ll make better decisions in less time.
Get Started This Spring
Central Alberta’s growing season is short. The best time to plan your scouting flights is before the crop goes in.
If you farm around Red Deer, Lacombe, Ponoka, Wetaskiwin, or Innisfail, we’ll come to your farm and show you what NDVI mapping looks like on your own fields. No obligation. You see the map, you decide if it’s useful.
Most farmers who try one scouting flight don’t stop at one.
Request a free quote or give us a call to book your first flight.
Ready to try drone services on your farm?
Get a free quote for scouting, mapping, spreading, or thermal monitoring across central Alberta.
Request a Free Quote